 Support l'X
 A public health data-visualization app developed by Msc&T students
The challenge was huge ! Five students from the "Data and Economics for Public Policy" Master's program, headed by X professor Pierre Boyer and ENSAE Paris professor Franck Malherbet, took it up.
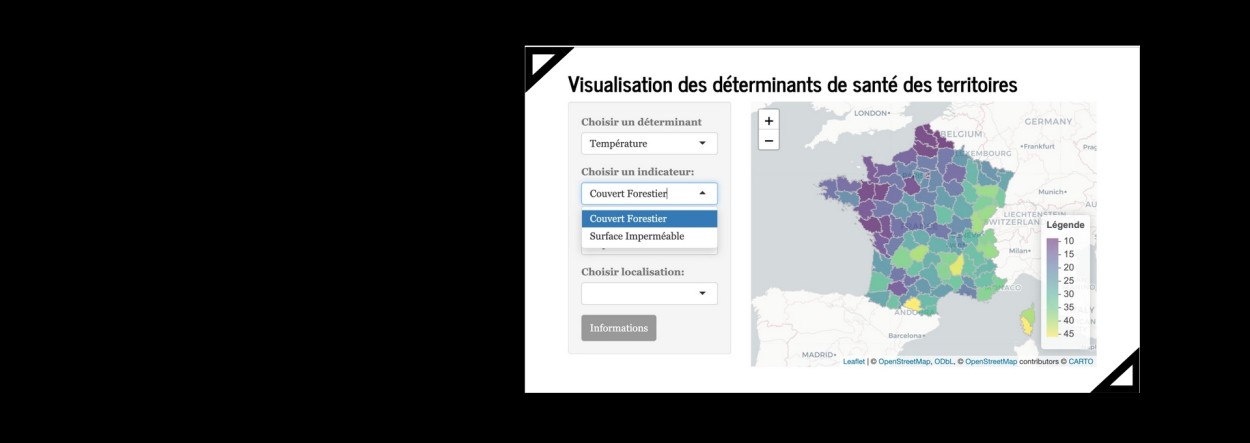
The task was to create a data vizualization tool of public health indicators families down to the French local authorities level, and even to a smaller scale if available, on behalf of Ecolab – the Greentech Innovation laboratory of the French Ministry of Ecological Transition.
Alfonso Awadalla, Jade Sillere, Julian Rojas, Maella Guillaume-Le-Gall and Sofia Vaca, graduates of a Bachelor's degree in Economics or Political Science, had no particular mastery of data management and visualization, which they developed as part of the MSc&T "Data and Economics for Public Policy" courses and in connection with this project.
The MSc&T "Data and Economics for Public Policy" is a program developed by École Polytechnique and ENSAE Paris in cooperation with Télécom Paris and designed to enable graduates to harness the power of data science and economic analysis to frame, formulate and implement public policies.
"Within a few months, the many projects proposed as part of the program pushed us to put our learning to good use and learn on the job to accomplish tasks that initially seemed unfeasible," emphasizes Alfonso Awadalla.
The project consisted in collecting, formatting and visualizing public health data in France down to the commune’s level or even below, on a battery of indicators grouped into 14 determinants, grounded on very diverse data sources both in nature and origin.
They carried out the work entrusted to them, which was presented at the Ecolab GreenTech Innovation of the French Ministry of Ecological Transition and Territorial Cohesion on March 22, dividing up the databases they were given according to their nature (satellite data, statistics...).
They were able to develop an interactive map of France with fourteen determinants (air quality, water quality, temperature, light pollution, biodiversity, access to employment, public services and infrastructures, safety, food, housing, income inequality...) that can be broken down to regional, departmental and local authorities levels, and even more finely in certain urban areas, subject to data availability.